FORAGER: The Agile Technology Driving Insight for Our Client Campaigns

How We Roll

In this post

Forager, our custom-built technology, provides insight into our clients' digital ad campaigns, giving them the information they need to drive business efficiently and effectively. Learn more about its evolution, capabilities and future plans.

For a company that has seen so many changes in digital advertising over the last two decades, one truth remains constant: technology is ever evolving in this space.  

When I joined Closed Loop in 2013 to develop internal and external software to help the agency scale its client services in the adtech and martech space, I was struck by the time it took to produce reports for our clients. This involved manually fetching analytics reports from providers such as Google Adwords, manipulating the data in Excel – some would call this Excel-hell – and extracting suitable insights from the rows and columns to drive changes in advertising campaigns and to report to clients.

As Chief Technology Officer and the creator of the internal technology that helps our team efficiently manage significant advertising spend across our portfolio of clients, I could not be more proud of the product that FORAGER has become all these years later. 

This is a little insight into the background of the technology, how it came to be, how it evolved, and how it services our clients in achieving exceptional growth through efficiently managed and optimized campaigns.

Table of Contents

What is Forager?

In marketing speak, we officially describe it in our client services as:

"...our custom-built data technology that integrates hyper-granular ad platform data with our clients’ back-end data systems. It gives us the end-to-end visibility needed for full-funnel optimization and unlocks deep insights by leveraging machine learning. It also provides our clients with custom BI dashboards they can use to actually run their business. Not just canned reports."

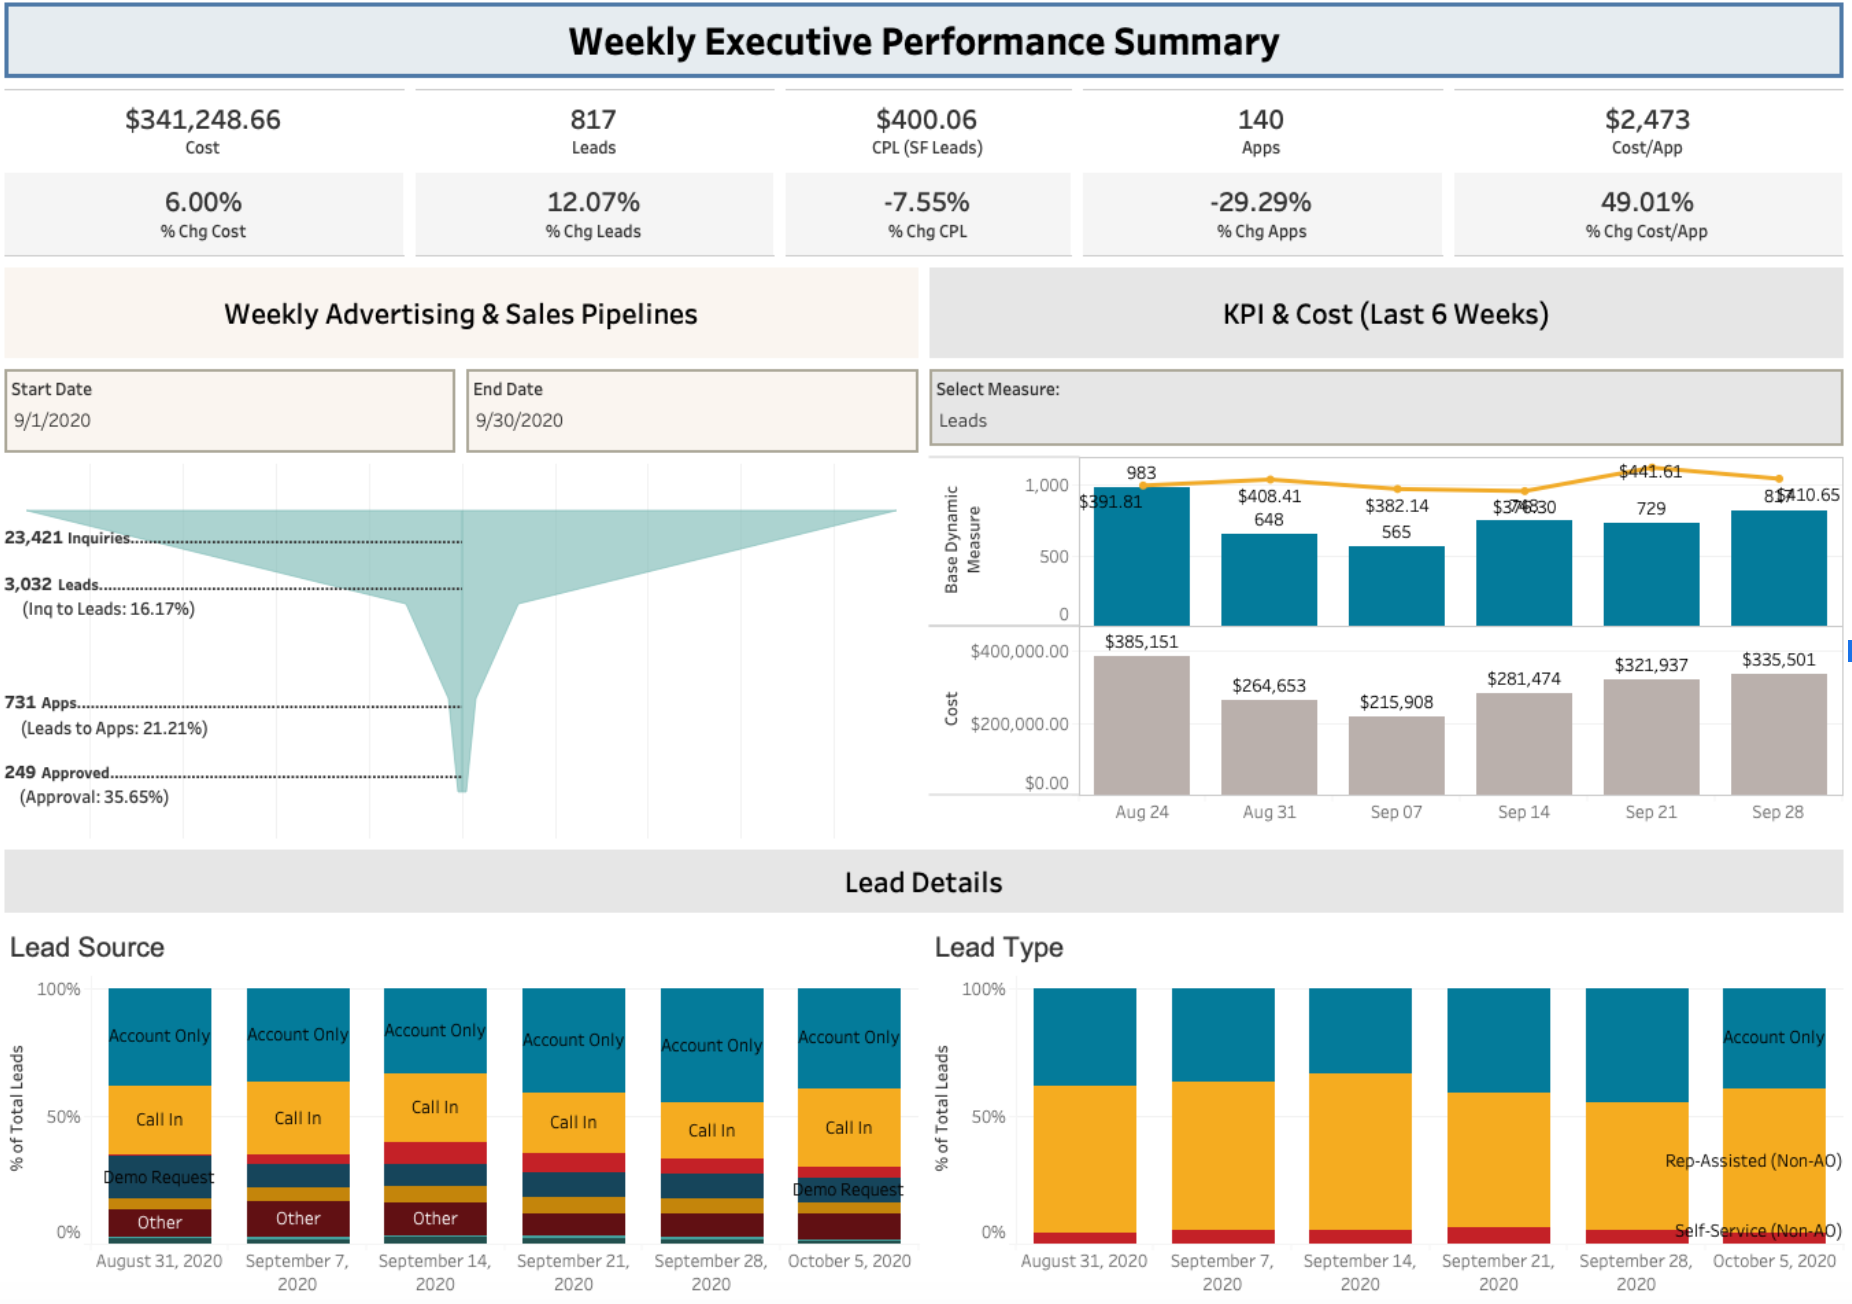
In technical speak, it’s a platform to extract data from the APIs of many advertising platforms (Google Ads, Facebook Ads, and many more) at a very granular level, store that in a data warehouse, and provide combined reports (see below) to drive a number of key visualizations for our advertising managers and clients. In addition, we now integrate reports derived from client’s own backend systems which often have information about conversion data that is not available to the advertising platforms.

Why Forager is best-in-class

Of course we might be biased, but at the core, we are proud to have built a system that effectively and efficiently:

  • Connects to and stores extremely granular data from to all major ad platforms
  • Provides fast access to data to power our custom visualizations
  • Combines and normalizes data from all platforms into a unified form to aid interpretation
  • Blends in other custom sources, such as client-originated data
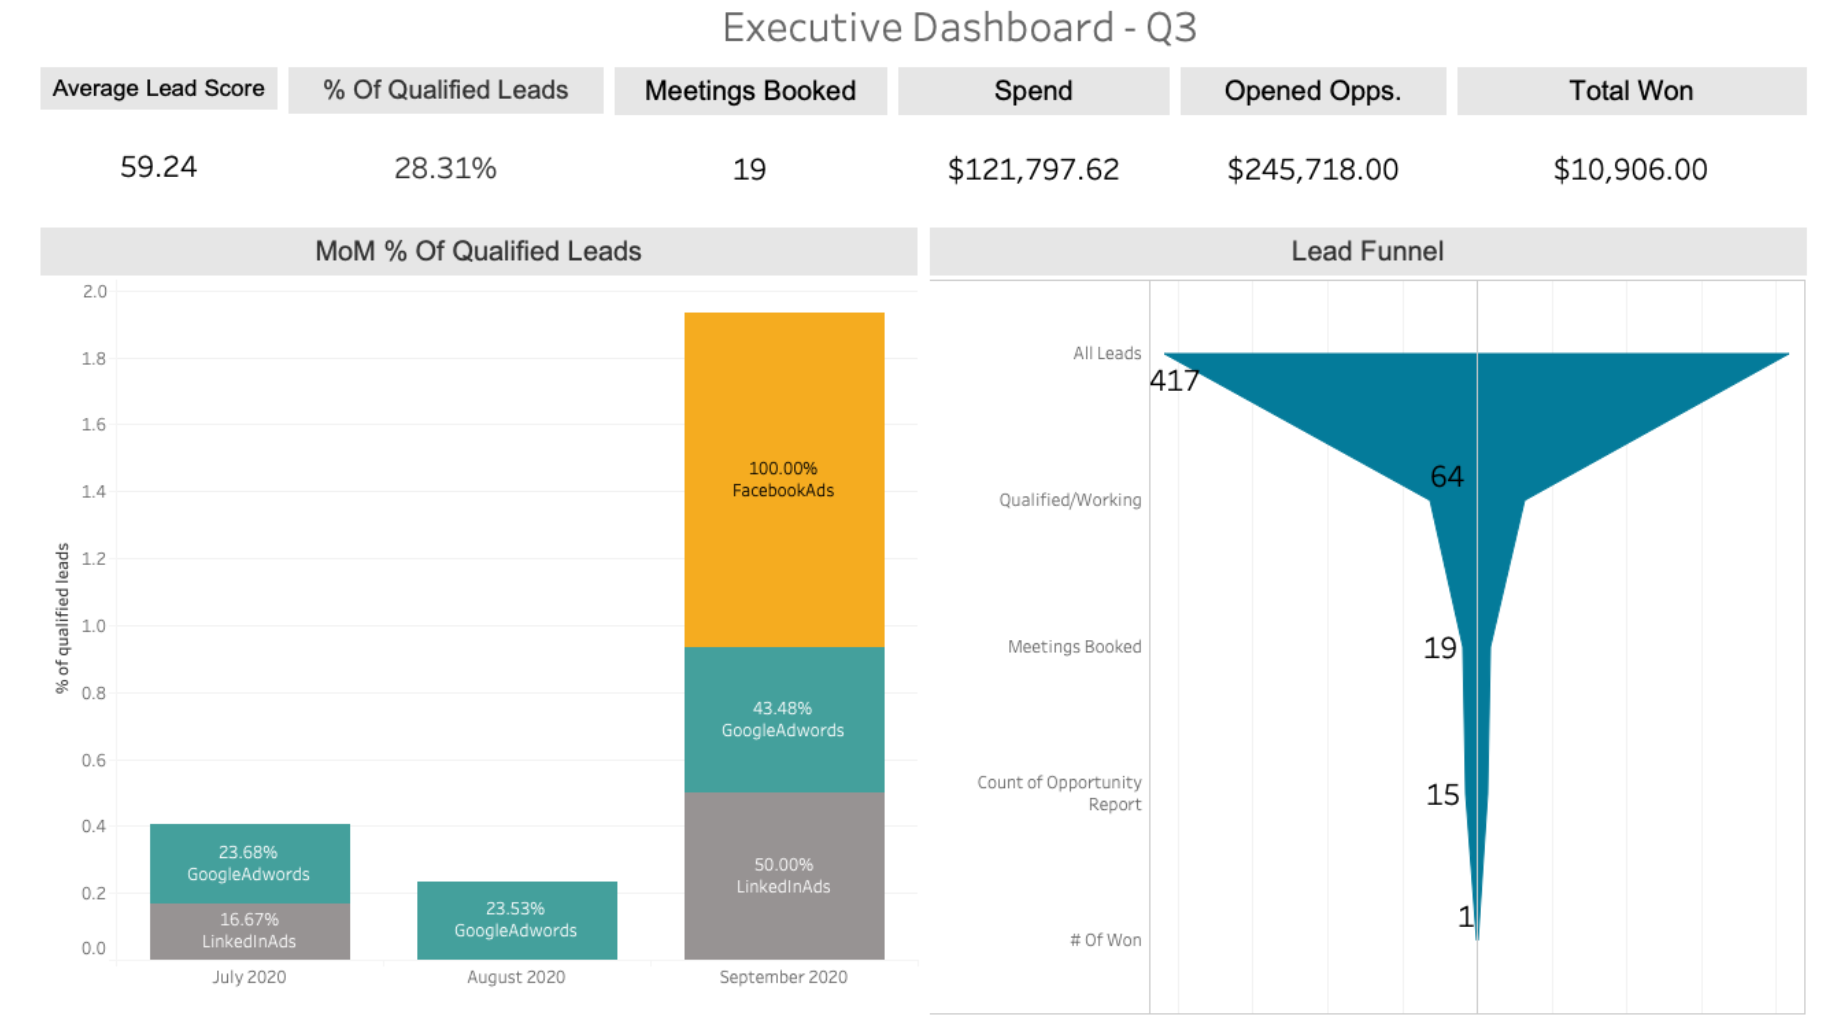
  • Provides “single source of truth” about client performance
  • Custom visualizations based on single source of truth

These were all features that developed as the advertising ecosystem evolved, diversified and grew across national and global economies, and as our clients became more sophisticated in their own internal marketing systems as well.

How Forager has evolved over time

Initially, when we built Forager, it was a way to streamline hours of manual reporting undertaken by Closed Loop account managers. It certainly has achieved that goal, and morphed into a real-time dashboard that any employee or client can view at a glance and instantly know how campaigns are performing across KPIs.

In the early days of Forager, the data integrations were much more limited. Most clients were using Google Adwords and some Bing Ads. Large scale advertising on social platforms was still in the future.

Our initial thought was to look at the connection between the ad content and the target landing page in order to identify disconnects that could result in low conversion rates. While this had obvious value to clients and ad managers, we quickly realized that we needed easy access to more granular and varied data.

We moved to fetching data at a granular level while still focusing on providing combined reports – in effect, abstracting away the semantic differences between the platforms. This provided us with a basis for creating visualizations for our clients which were well received. It was also moderately easy to expand to other search platforms and to explore other views – keyword views and geographic views provided valuable insights. However, the increase in advertising on social platforms – Facebook initially, followed by Twitter, LinkedIn and others – started to cause significant strain on our models.

Our next move was to a more flexible approach that allowed us to describe the mappings between platform metrics and those needed to drive our visualizations which accommodated all platforms. This continues to stand us in good stead even as the platform data has morphed.

We already have some limited machine learning capabilities integrated to allow us to get better information about ad content, and expect this to increase in the future.

Our clients find value in their custom dashboards

Every client is unique in terms of their business goals, martech stack and how we work together to execute the media strategy. After doing the heavy lifting to tie all the reporting tools together into Forager, normalizing the data and building out customized reporting dashboards the end result is ultimately the same for the marketing executives who come to rely on the platform’s capabilities.

“I’m the happiest kid in the candy store with Closed Loop’s dashboards and reporting. I’ve got trend charts, executive dashboards, channel summaries, all my KPIs in one view, and filters to cut the data in all the ways I want: by audience, creative, acquisition/retention, mobile/desktop. Closed Loop has been super nimble in continuously customizing these to meet our changing business needs. I love them! These tools enable me to derive insights for the business very quickly. We’re a lean team that couldn’t do this on our own—so I am so appreciative that Closed Loop can amplify our impact.”
Dan Reardon
Head of Performance Marketing, Vudu


Example dashboards:


Future of Forager

The advertising industry is ever-evolving, and we remain committed to growing and adapting with it, and that includes our technology and reporting infrastructure. As advertising platforms continue to gain new capabilities and varied reporting structures, our focus will be on continuing to solve these challenges at scale:

  • Increasing fragmentation of ad platforms and martech stacks demand flexibility and scale in how we integrate data into our reporting.
  • Solving attribution issues for device types and audiences that may be difficult to track.
  • Providing insight into ad platforms that, through the use of machine learning algorithms are making it difficult to capture data around audiences and ad performance. are increasing opacity to data and audience performance.
  • Working with our clients to work feed data into ad platforms for optimal performance in light of the industry move away from cookies.

Our commitment, as always, is to work with our clients to deliver real value in reporting, and ultimately across their marketing investments as a whole, gaining clarity and insights through transparency.

It's Finally Here

Average is Losing: A Playbook for Dominating Digital Advertising

My new book, “Average is Losing” is finally here! I created this playbook to help savvy advertisers close the gap between winning and run-of-the-mill paid advertising campaigns.

It’s filled to the brim with the latest strategies, tactics and tips our Closed Loop experts use to help our clients seek exponential growth.

Are you ready to rise above average campaign performance? Start your business on the path to PPC domination today!

– Lance Loveday